Business
Ethereum Market Update and Price Recovery Analysis
Stay informed with the latest Ethereum market update and price recovery analysis. Explore insights on the current market trends and potential price movements in the Ethereum ecosystem.

Ethereum Market Update

After experiencing a notable decline of almost 20% in the past four weeks until July 5, the ether (ETH) market is showing signs of potential bullish momentum as sellers seem to be exhausted.
On an early Monday, the native token of the Ethereum blockchain, Ether, surged over 4% to reach $3,050, rebounding from a critical support level as per data from CoinDesk.
This recovery, in combination with various indicators reflecting demand and investor sentiment, hints at a possible bottoming out of the cryptocurrency just ahead of the upcoming launch of spot ether ETFs in the United States this month.
Coinbase and Grayscale Discounts Disappear

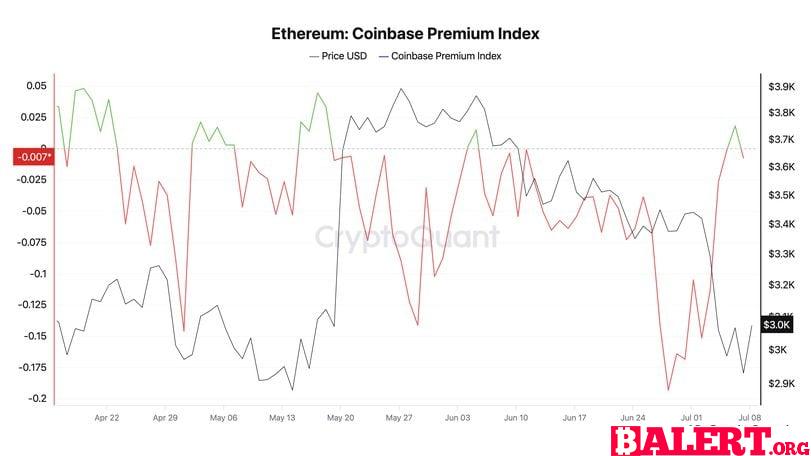
Ether is no longer trading at a discount on the Nasdaq-listed Coinbase compared to Binance, indicating a potential shift in sentiment and a reduction in selling pressure.
The ether premium index by CryptoQuant, measuring the difference between Coinbase’s ETH/USD pair and Binance’s ETH/USDT pair, has risen to neutral from a significant discount at the end of June, pointing towards a change in market dynamics.

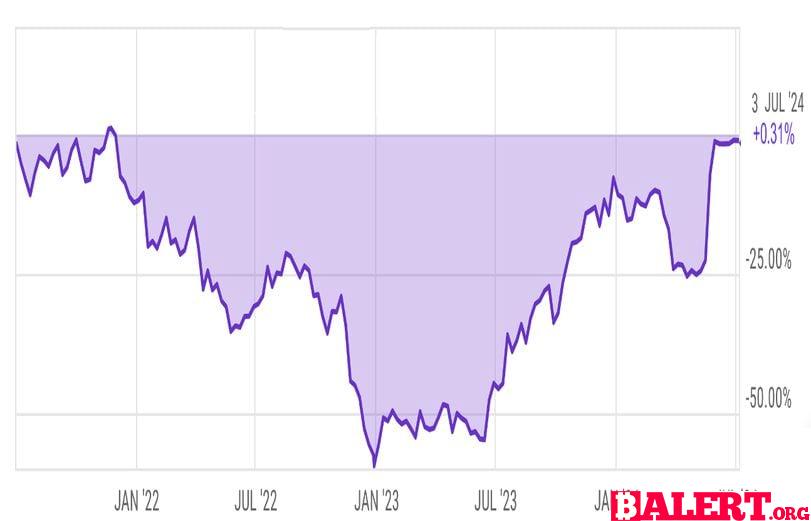
Additionally, the discount to net asset value (NAV) for the Grayscale Ethereum Trust (ETHE) has disappeared for the first time in over two years, signaling growing investor confidence and interest in ether-related investments.
Market analysts suggest that the anticipation of SEC approval for Ethereum ETF trading, expected around mid-July, has contributed to the elimination of the NAV discount, paving the way for potential increased demand for ether investments.
Sellers Struggle to Break Key Support
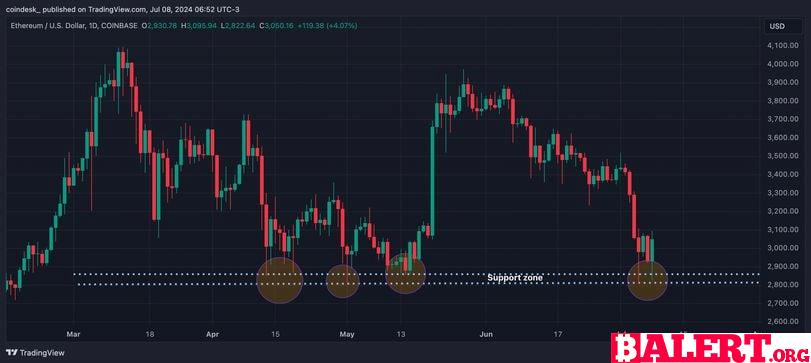
The recent price recovery of ether above $3,000 is significant as it followed a successful defense of the crucial support zone between $2,800 and $2,850.
Buyers have consistently defended this support level since late April and early May, establishing it as a critical level for market participants. The emergence of long-tailed daily candles at this support zone indicates a lack of selling pressure and potential exhaustion among sellers.
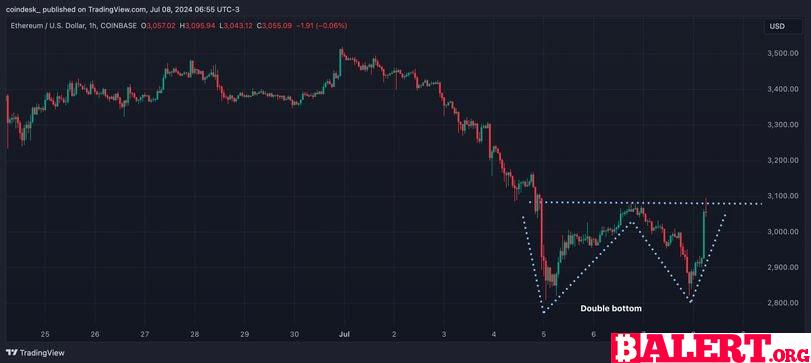
Moreover, the presence of a double bottom pattern on the hourly chart, typically signaling a potential reversal from a downtrend, further supports the notion of a bullish turnaround. The repeated testing and holding of support levels suggest that sellers are facing challenges in driving the price lower.